❓ How to Use the 📈 Zig-Zag Indicator 📉 - A Simple Tutorial 🧑🏫
Explanation of applying the Zig-Zag Indicator, which is popular as a Scientific Dow Trend Generator and Elliott Wave Indicator.
by Alan Collins
1) Zig-Zag Indicator 5% and 10%
Sidney S. Alexander developed the numerical framework of the Zig-Zag indicator as a profit protection mechanism [1], [2]. Later, Arthur Merrill formulated the Zig-Zag indicator as a method to graphically represent the Alexander Filter. Merrill writes that he would generally use the 5% and the 10% values [3]. He used this indicator as an integral part of his regular technical analysis [4].2) Zig-Zag: The Scientific Dow Trend Generator and Elliott Wave Indicator
One of the advantages of the Zig-Zag indicator is that it can be used to draw objective Dow Trend waves and rule-based Elliott Wave lines. This removes the impressionistic nature of traditional Dow Graphs and Elliott Charts, which are typically hand-drawn by analysts.3) Criticisms Addressed: The Repainting Issue
One of the criticisms levelled at the zig-zag indicator is that it repaints, which means that previously displayed values can change or adjust based on current variations in the price. Now, it is undeniable that certain swing turning points do regularly disappear on repainting. However, the zig-zag indicator does predict every single major turning point. The question is then essentially one of probability. The zig-zag indicator correctly predicts every single turning point, it does give false signals along the way - just like very other indicator. Moreover, it is advisable to combine the zig-zag indicator with fractals, which provide another independent way of displaying swing changes in price which mark the end of trends. Doing so further increases the accuracy of the zig-zag indicator.📝 References 📃
- ^ Alexander, Price Movements 1 .
- ^ Alexander, Price Movements 2 .
- ^ Merrill, Filtered Waves .
- ^ Merrill, Stock Selection, p.239-242.
📘 Bibliography 📗

|
Alexander, Sidney S. 'Price Movements in Speculative Markets: Trends or Random Walks'. Industrial Management Review, Volume II (May 1961): 7-26. |

|
Alexander, Sidney S. 'Price Movements in Speculative Markets: Trends or Random Walks, No.2'. Industrial Management Review, Volume V (Spring 1964): 25-46. |

|
Merrill, Arthur A. 'Filtered Waves Basic Theory: A Tool for Stock Market Analysis'. 1st Edition. Chappaqua (New York): The Analysis Press, 1977. 181pp. ISBN: 0-911894-36-5. Borrow or Buy: [ amazon | biblio | worldcat | abe | isbnsearch | justbooks.co.uk | gettextbooks | goodreads | openlibrary | univ. manchester | librarything ]. Noted book. |

|
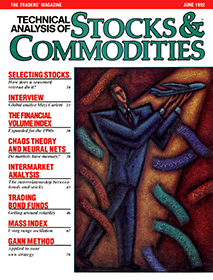
Merrill, Arthur A. 'Stock Selection'. Technical Analysis of Stocks and Commodities, Volume 10, Issue 6 (Jun. 1992): 239-242. |