Share This Now!
Copyright © 2021 AssetCharts.com. All Rights Reserved.
Liability Disclaimers: AssetCharts.com assumes no liability for or any profits
or losses accruing to your account for any reason.
Risk Disclaimer: Investing carries risk of loss. In equity or stock markets,
you may lose all your money. In the extremely risky derivatives (futures and
options) markets you may lose more money than your deposit. Paper-trading is
advisable for beginners, followed by small-value investments in markets.
Warranty Disclaimer: AssetCharts.com and associates assumes no warranty or
fitness for any content, data or information on its websites.
All Entities Fictitious Disclaimer: All entities (including human and
non-human) mentioned on this website are fictitious and not based on real
entities. Any resemblance to actual entities or persons, past or present, is
entirely coincidental.
Data and Chart Disclaimer: Due to changes by our data suppliers, or due to
calculations necessitated by bar type (including Heikin-Ashi), and various
other reasons, prices and/or
timeframes for charts may not match those prevailing in actual markets at any
given point of time. End-users are advised to double-check prices and times
using their own data feeds or broker terminals.
By using this site, you agree to all the terms, conditions and disclaimers at
http://assetcharts.com/en/about/about.html and
http://assetcharts.com/en/about/disclaimers.html
The End
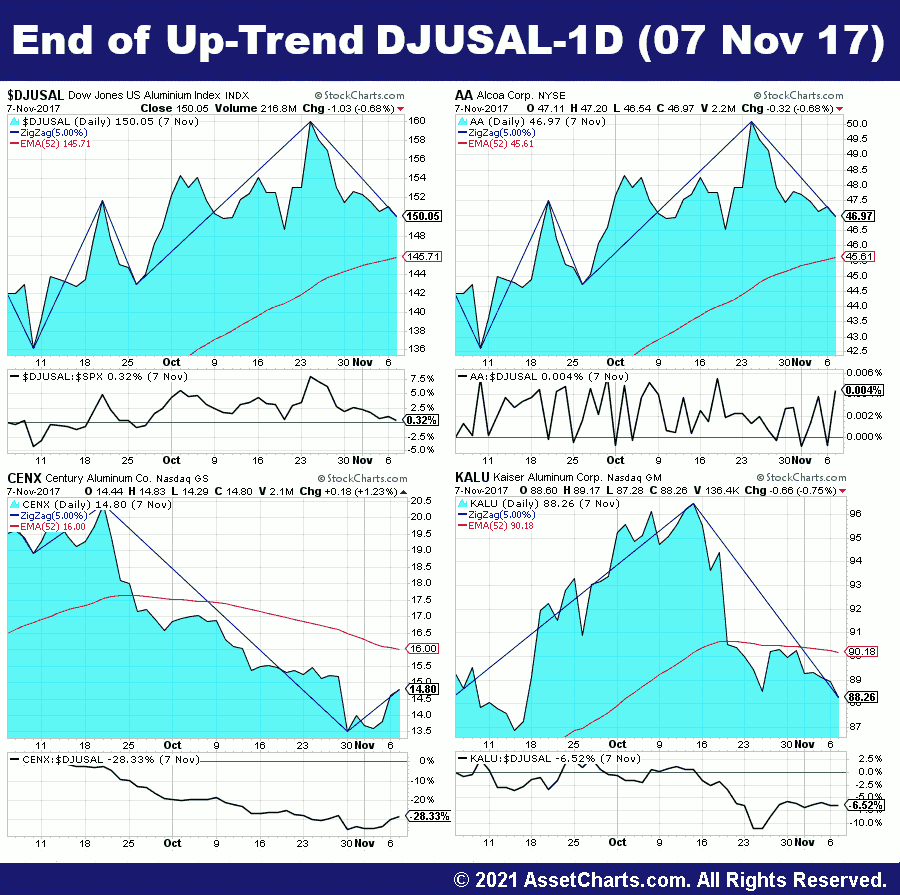
 Fig.3: End of Sector Upmove.
Kindly Click to Enlarge the High-Quality Sector Rotation Chart.
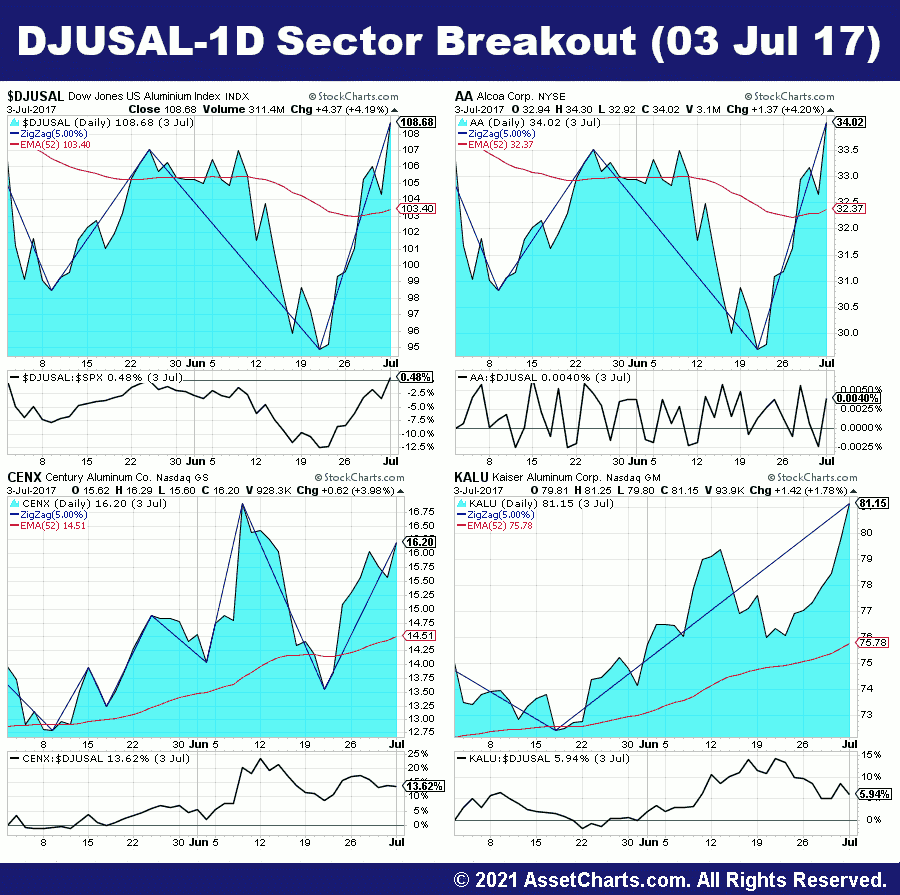
 Fig.1: Sector Breakout in DJUSAL on 3rd July 2017.
Kindly Click to Enlarge the High-Quality Sector Rotation Chart.
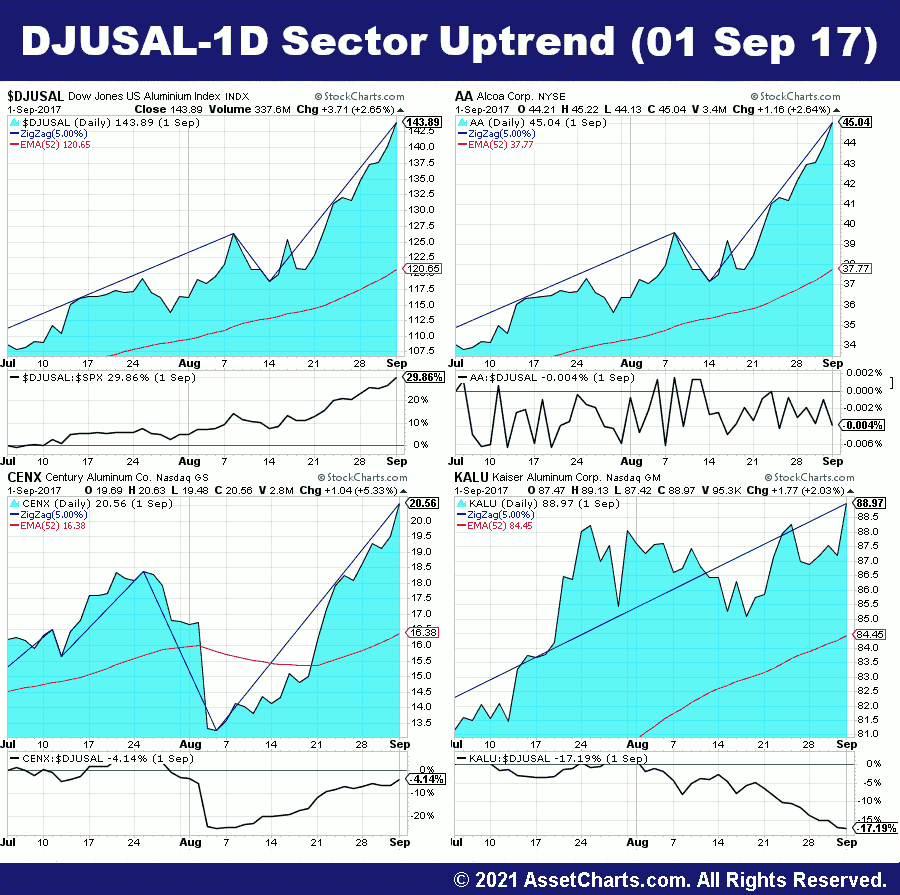
 Fig.2: Sector Uptrend in DJUSAL on 1st Sept 2017.
Kindly Click to Enlarge the High-Quality Sector Rotation Chart.